How Quip Builds In-Product Debugging Tools
Creating customized tools to aid the development process is something that many engineers end up doing. Quip is no exception — over the years we've accumulated many command line utilities, admin tools, customized REPLs and the like. In particular, we've become fond of “in-product” debugging tools. With these tools, it's possible to investigate an issue or get extra information that makes the development process smoother — without having to leave the Quip app.
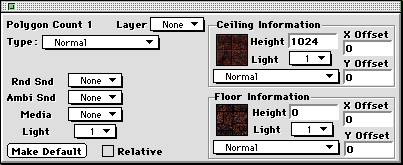
A long time ago, I used to create levels for Bungie's Marathon series of games. Initially, an official level editor was not available, but an intrepid developer had created Pfhorte. The user guide gives a taste of what it was like, but the general workflow was:
- Edit your level using a combination of a top-down 2D view and inspectors with lots of options for every polygon and entity
- Launch the game, go to the level and then walk to where you had been editing (if you didn't remember to move the spawn point)
- See if you got what you expected
- If not, quit the game and go back to step 1
With the final game in the trilogy, Bungie released their own editing tools, including the level editor Forge. This featured an embedded instance of the game engine, allowing you view the level directly in the editor, “shoot” textures at walls and other forms of direct manipulation, and in general have a much faster iteration cycle.
That was my first exposure to integrated development and debugging tools, and I was reminded of it many years later when working at Quip. This post describes a few places where we've created such tools to help with our development. They augment our abilities and have significantly repaid the time spent creating them, creating a positive feedback effect. Once the effectiveness of the first few tools was apparent, it became much easier to justify the time spent creating them, and we added even more to our collection.
ID Overlay
As we were rebuilding Quip's UI with React, I increasingly wanted to “see the Matrix” when working on a component. If the component was backed by one more model objects, I would often want to see those objects to debug rendering glitches, see why data was stale or explore the model to see if what I needed was available. This normally involved inspecting the component (either its DOM or its props using React's Developer Tools), figuring out the IDs of the objects that it used, and then using some “pretty print” commands that logged data to the console. Not only was this work tedious, but it didn't work at all in production (where JavaScript was minified and the developer tools did not work).
What I ended up doing was adding an “ID Overlay” where each component could optionally render green model object links (the color choice may or may not have something to do with the above-referenced movie). Clicking a link would bring up an interactive inspector that used a React-ified version of the protocol buffer text format to have an interactive view of the model data.
This not only helped with local development, it also proved to be very useful in production. If someone reported that a message or other model-back component was not rendering correctly, it was easy for them to enable the overlay, grab the object's ID, and include it in the report.
Here we can see the ID overlay being enabled, a couple of objects (a document and a message) being inspected, as well as a reference from the message to its author being expanded.
Editor Data Overlay
The Quip editor is similarly backed by a rich data model, but we ended up using a slightly different approach for the “data overlay” that it has. While we could use the same approach of display entity IDs and showing the data in an inspector, it's useful to see the details inline as the document is edited. Many bugs are timing sensitive and having to open an inspector (and lose keyboard focus) would make them hard to reproduce.
Instead, we ended up embedding the debug data directly in the document. The developer can configure how much detail is shown, from just a bare ID, to extra attributes and even to other referenced entities.
In this animation, the overlay is enabled, a new “section” is created (observe its ID changing from the temporary client-assigned one to a permanent one) and then edited (the set of dirty fields appears) and saved (the set of dirty fields disappears).
Estimated Size Overlay
The previous debugging tools are for pretty generic use, but occasionally more specialized ones are needed. A while back we wanted to optimize the rendering of Quip documents, such that we only showed what was visible “above the fold” in an initial pass, and the rest was displayed later. This posed a catch-22 of sorts, since precisely measuring what was visible (given line wrapping, etc) would be nearly as expensive as rendering it, thus not saving us any effort. We instead wanted to have an “estimated height” heuristic, that given the data model could approximate the rendered height without doing any actual layout (by doing things like looking at the number of characters and the expected number of character per line given the current width).
To validate this estimator on a broad variety of documents, we ended up building a simple estimated size overlay that could be enabled. For each block of text in the document, it would show how tall we estimated it to be. Having this visual representation of it allowed us to quickly iterate on the heuristic and validate the results visually.
Though it might seem wasteful to build a UI for a one-off need, this feature has come in handy every time we've added new content types to documents: we can re-enable it and quickly do a visual sanity check that sizes are being estimated correctly.
Viewport and Caret Size Overlay
When working on the mobile version of Quip, one of the mobile-specific aspects that we had to worry about was the on-screen keyboard. For example, when the user is doing text entry, we want to make sure that the caret is never under the keyboard.
To ensure that we correctly accounted for this, we ended up building a —you guessed it!— overlay that showed the current visible area size (in purple), the size of the currently focused text block (in red) and the size of the caret (in green). It could then be left on as we interacted with documents in various states (short/long, near the top/bottom of the screen, while wrapping from one line to another). If we ever computed the wrong thing, it would become immediately apparent.
This overlay has also proven its value over time, as mobile screen sizes changed, third party keyboards became available on iOS, and OS behaviors changed.
React Re-Render Count Overlay
To make sure that we minimized the number of React component re-renders during performance-sensitive operations, we added an (optional) overlay that would show the update count for each component.
As you can see in the recording below, the items in the list that is being reordered do get re-rendered, but ones in other lists are untouched.
To implement this, we injected a componentDidUpdate method into all components that incremented a counter and set it as a data-react-rerender-count attribute. Then with a CSS rule we could show it:
.debug-react-rerender-count:after {
    content: attr(data-debug-react-rerender-count);
    // other styles for positioning and color
}
Doing this via a data attribute and CSS generated content meant that we could minimize the number of DOM manipulations that this overlay did, so that it would not significantly impact performance itself.
Drag Overlay
When we added the ability to drag and drop text blocks in the editor, we wanted to make sure that the “snapping” behavior felt natural. A lot of computations need to happen during the drag to figure out the best snap point given the current mouse location. To debug them via traditional methods (stepping through the code or logging) would be very tedious, since a lot of data would be generated very quickly.
What we ended up doing instead was to create an overlay that showed the scores associated with each candidate next to it. This way, it was possible to see how many values changed as the mouse moved, without having to let go of the mouse or otherwise interrupt the operation.
Worth the investment?
Quip is by no means unique in having all of these in-app debugging tools. The developer tools built into every browser are examples of this, and others have built similar systems (FLEX and Peek are two from the iOS world). What I've come to appreciate is that the investment in these tools is almost always worth it, even if it's not something that users will see directly. We do periodic surveys of our engineering group, and these tools are always one of the biggest vote getters in the “most loved” category. My guess is that the biggest benefit often comes from “bespoke” tools that are particularly suited to your project or particular task, since they can be tuned to the exact use case that's needed.
As for seeing Quip's debugging tools in action, they are disabled by default in release builds of the app. However, if you'd like to “cheat” there may be a way — keep in mind that Marathon didn't have any cheat codes but one of its contemporaries did.
